-
McKinsey Forward Program
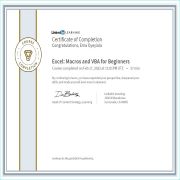
It was an intense 10-week program, with focus on Adaptability & Resilience, Communicating for Impact, Problem Solving, and Relationships & well-being. Every minute spent was well worth it!
View here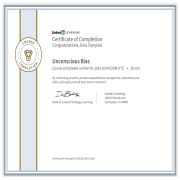
Unconscious Bias
This was a fantastic good use of my half hour! I absolutely recommend it to anyone looking to polish their soft skills.
View here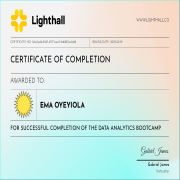
Data Analytics Bootcamp
I did a thing with LightHall, and joined a 5 week intensive Bootcamp to refresh my data analytics skills.
View here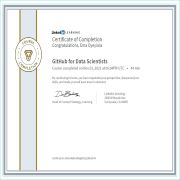
Github for Data Scientists
I needed help understanding my way around Github, and this course worked magic!
View here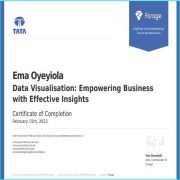
Data Visualization: Empowering Business with Effective Insights
I wanted to build a portfolio, and Forage helped by providing guidiance to data analytics.
View here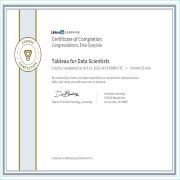
Tableau for Data Scientists
An important tool to visualize data is Tableau. Tableau is amazing as it handles very large volumes of data real quick, and gives you an all-round view to your data
View here
Power BI Essential Training
Power BI is also a major tool used for Visualization by most Data Analysts. Most businesses and organizations tend to visualize their data using Power BI, because it drills down into the nitty gritty of data, and is a much cheaper option.
View here
Power BI Data Modeling with Dax
After learning Power BI, I realized there was a need to polish off my skills by learning DAX to simplify tasks.
View here
