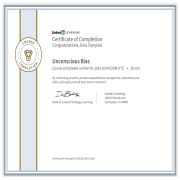
Linkedin Learning
This was a fantastic good use of my half hour! I absolutely recommend.
Your prefered Data Analyst

This was a fantastic good use of my half hour! I absolutely recommend.
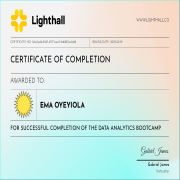
I joined a 5 week intensive Bootcamp to refresh my data analytics skills
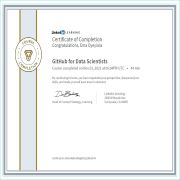
I took this course on Github to help me understand how to leverage my Github account
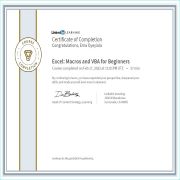
I needed a better understanding of VBA, what better learning than Linkedin Learning?
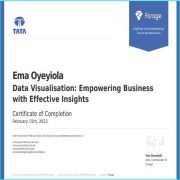
Want to build your analytics portfolio and showcase your skills? Forage is the place to go!
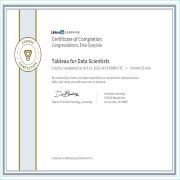
An important tool to visualize data is Tableau. Tableau is amazing as it handles very large volumes of data real quick, and gives you an all-round view to your data. It is however a more expenisve option.
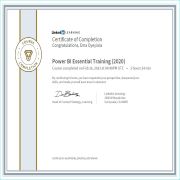
Power BI is also a major tool used for Visualization by most Data Analysts. Most businesses and organizations tend to visualize their data using Power BI, because it drills down into the nitty gritty of data, and is a much cheaper option.
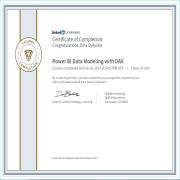
After learning Power BI, I realized there was a need to polish off my skills by learning DAX to simplify tasks.